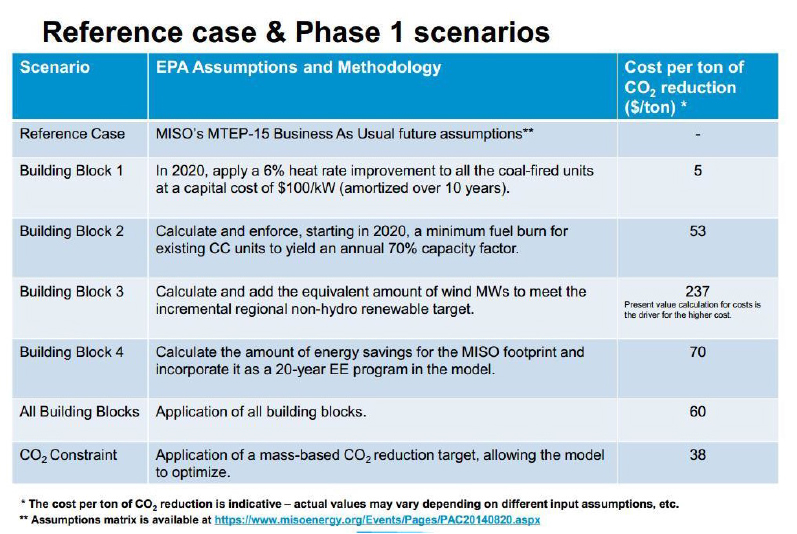
A Critique of Brookings Institutution’s Mark Muro and Devashree Saha: Rooftop Solar: Net Metering Is A Net Benefit by Tom Tanton, E&E Legal’s Director of Science and Technology Assessment Across the country, more and more electric utility customers are using rooftop solar panels and other small-scale, on-site power sources known as distributed generation (DG). To encourage the introduction of these systems when they first came to market years ago, many states imposed a billing system called net metering. Currently, forty-three states plus the District of Columbia have net metering policies and regulations. While these policies vary in details, customers with such systems are typically credited at the full retail electric rate for any excess electricity that they generate and ‘sell’ back to the utility. The retail rate includes the price of the energy itself, as well as the cost of paying for the grid. The grid moves electricity to and from net metered customers and assures that power supplies operate safely and reliably. In most net metering states electric companies are required to buy this power at the retail rate, even though it would cost less to produce the electricity themselves or to buy the power on the wholesale market, and this arrangement leaves others to pay for infrastructure. In May, the Brookings Institute published a paper, by Muro and Saha, purportedly aimed at addressing the policy question posed by the growing level of net metered electric utility customers and the growing debate about its economics. They concluded that “Net metering — contra the Nevada decision — frequently benefits all electric utility customers when all costs and benefits are accounted for…” This brief assesses the Brookings paper and finds it lacking in approach and coverage of issues. New distributed generation technologies rely extensively upon the electric grid to operate efficiently. They need the distribution grid to be changed from a one-way delivery system to a complicated two-way network, a process that demands extensive investment in new technologies. Nationwide utilities are spending billions to achieve that end. In 2015, electric companies invested $20 billion in the distribution system alone and this is expected to continue. Over the past five to six years, electric companies invested in the deployment of nearly 65 million digital smart meters to about 50 percent of U.S. households, one critical technology that enables net metering. Ironically, however, net metering policies permit distributed generators to avoid paying their share of the costs of these grid investments, leaving the costs to be paid by other electricity users. The growing use of distributed generation and its impact on electric utility customers means that net metering policies and regulations need to change to properly allocate costs and to minimize the impact on non-net metered customers. Net metering policies pose a threat by neglecting to fund the critical infrastructure called the electric grid. Net metering upends the historical regulatory compact, conflicts with federal law, and creates perverse economic inefficiencies. Net metering, as currently implemented in some states, is a regressive tax subsidizing the rich by picking the pockets of the poor. Nearly every state with a net metering policy are making or contemplating changes , either through their public utility commission or legislature. Most are, correctly, focused on the price to be paid for excess generation. Selective compilation without new analysis As Lisa Wood, a nonresident Senior Fellow at Brookings and lead at the Institute for Electric Innovation, points out “In reviewing NEM studies, Muro and Saha chose to focus on a handful of studies that show that net metering results in a benefit to all customers, to the exclusion of studies showing the opposite. In this small group of NEM studies, they included a study that E3 conducted for the Nevada Public Utilities Commission (PUC) in 2014–perhaps the most well-known and cited of the five studies included in the Muro/Saha paper. Very soon after the E3 Nevada study was published, the cost assumptions for the base-case scenario which showed a net benefit of $36 million to non-NEM customers (assuming $100 per MWh for utility-scale solar) were found to be incorrect, completely reversing the conclusion. The $36 million net benefit associated with NEM for private rooftop solar turned into a $222 million cost to non-NEM customers when utility-scale solar was priced at $80 per MWh. Today, based on the two most recent utility-scale contracts approved by the Nevada PUC, utility-scale solar has an average lifetime (i.e., levelized) cost of $50 per MWh, meaning that the NEM cost shift would be even greater. In February 2016, the Nevada PUC stated that “the E3 study is already outdated and irrelevant to the discussion of costs and benefits of NEM in Nevada…”[2] Hence, because the E3 study for the Nevada PUC that the Muro/Saha paper included has been declared outdated and irrelevant to the discussion and because costs for utility-scale solar have declined significantly, that study does not show that NEM provides a net benefit to all. By focusing on a select group of studies that show that NEM benefits all customers (as stated by the authors); by excluding the E3 study for the California PUC, which is fundamental to the NEM cost shift debate; and by not providing an update on the NEM debate today” the Muro/Saha paper is misleading. Definition of Benefits is Dependent on Cost of Electricity and Value of Carbon While the Brooking paper’s cited reports include an inconsistent variety of benefits (and a variety of costs) one consistent benefit is avoided costs of electricity from the incumbent utility. In other words, net metering customers benefit by not purchasing as much electricity from the utility by virtue of the self-generation. Obviously the higher the utility cost (or more correctly price) the larger this benefit becomes. Including historical and forward looking studies, the paper cited studies done in seven states.[3] With the exception of Mississippi, each of the studied states have aggressive Renewable Portfolio Standards (RPS) which require utilities to purchase specified amounts from qualifying renewable resources. The remaining states, other than Mississippi, have more aggressive RPS than the average RPS, thus artificially raising the cost of electricity in those states.[4] Overall electric price in four of the seven states are above the national average by at least 25%. In the remaining three, prices at just below (by less than 10%) the national average, and since their RPS was put in place their electric price advantage has been rapidly eroding. Thus, a portion of “benefits” included in the analysis of NEM are actually costs imposed by RPS policy. Claiming benefits of NEM actually attributable to costs imposed by other policy is misleading at best. Further by conflating historical looking studies with forward looking studies implies the benefit/cost is a fixed ratio regardless of the amount of NEM within a utility system and across utility systems. Each utility system has differences that make such conclusions meaningless. Looking just at the benefit of reducing carbon emissions, the benefit calculations are likely inflated. Valuing carbon emissions at the ‘social cost of carbon’ (SCC) requires an unambiguous value for the social cost of carbon. Most of the studies cited value carbon at the SCC as determined by EPA. The EPA’s values range from $11 to over $212, depending on when the reduction occurs and discount rates and other factors. Further, as Reason Foundation Vice President Julian Morris “finds the administration’s estimates of the social cost of carbon are “biased upwards” due to their reliance on three “simplistic models, all of which use estimates of climate sensitivity that are likely too high and two of which likely overestimate the economic impact of climate change.”[5] Taken together, these two factors call into serious question the validity of the cited studies, something most state utility commissions are doing. Electricity costs and value of carbon emissions are not the only questionable benefits in the papers included by Brookings, but those two questionable values are illustrative of the misleading ‘net benefits’ cited by Brookings. Less Costly Measures Are Available (Benefits exceeding costs is inadequate for public policy) Using benefit/cost analysis as the “be-all” is short sighted and often leads to poor policy. While necessary, it is insufficient. Use of benefit/cost alone ignores the equally important question of whether the benefits can be achieved at less cost. Are other techniques available that reduce carbon emissions, improve reliability, lower pollution levels at overall cost less than net metering? The answer is yes. Returning to the question of the economic benefit of reduced carbon emissions, the Midcontinent Independent System Operator (MISO) analyzed various options to reduce carbon emissions in response to the Administration’s proposed “Clean Power Plan.” They compared the cost per ton of carbon reduced for a variety of generation and energy efficiency measures. They did not address NEM directly, but the results are still illustrative. The comparison of costs is shown in the figure, and illustrate that carbon can be reduced much more cheaply with easy operational changes like improving power plant heat rates or increased use of natural gas combined cycle than with most renewable technologies.[6] The benefit of reducing carbon dioxide, and by extension NEM benefits, can most likely be achieved without resorting to the most expensive form of electricity generation. Benefits Exceeding Cost for ‘Society’ Ignores Fairness and Equity A number of states have attempted to look at the question of rate impacts of net metering, specifically whether a subsidy or “cost shift” is occurring from non-participants to those participating in net metering. In using or comparing the results from the various studies, a few caveats need to be kept in mind: A 2010 E3[7] study, commissioned by the California Public Utilities Commission (CPUC), specifically looks at the quantifiable, incremental costs and benefits of net metering. The benefits are calculated as utility-avoided costs of energy and capacity procurement. The CPUC called the E3 report methodology “the most rigorous and quantitative methodology ever conducted on the NEM mechanism.” The costs and benefits are evaluated for both participants in net metering as well as other, non-participating electric utility customers and utilities. E3 also estimated incremental operational costs to the utility of net metering, which would theoretically include incremental interconnection, integration and billing costs; however, only data for billing costs were available. Integration costs were not quantified. One example of integration cost is the additional natural gas fuel burned to balance and backup intermittent solar and wind. Another oft-cited study, by LBNL in 2010,[8] did not examine the value of net metering of solar to non-participating electric utility customers; instead, the authors reviewed the impact of retail rate design on hypothetical net metering bill savings. Overall, they concluded that if a feed-in tariff[9] were employed to compensate net metering customers rather than rate-based compensation, the prices would need to be well above the current avoided cost to continue to drive solar market growth. In January 2012, R. Thomas Beach and Patrick G. McGuire of Crossborder Energy[10] reevaluated their own and LBNL’s earlier analyses. In 2012, they looked only at the PG&E utility territory, which includes more than two thirds of the net costs of net metering for non-participants, as well as for all electric utility customers across the state of California. They updated the analyses because, since the 2010 studies, the CPUC significantly restructured PG&E residential rates, which lowered net metering rates and reduced the rate impacts of those customers to non-participants. Beach and McGuire also incorporated new avoided cost modeling that assumes greater benefits of net metering(as discussed above), largely because of a separate state mandate, the Renewable Portfolio Standard. E3 had calculated that residential NEM customers impose a net cost of $0.19 per kWh of power they export to the grid, a significant level given that the average IOU residential rate is in the range of $0.17 to $0.19 per kWh. One key point on which several studies agree is that, in the final analysis, any “cost shift” resulting from NEM is a function of rate design. Rate design is the purview of public utility commissions in each state and Boards for publicly owned utility. Other studies have attempted to quantify the value (but not costs) of distributed solar photovoltaics in geographically diverse areas, each of which is summarized briefly below. In 2006, Clean Power Research, LLC,[11] performed an analysis of the value of distributed solar photovoltaics to Austin Energy and the City of Austin (i.e., to the utility and to electric utility customers), to support the municipal utility’s plan to install 100 MW of solar by 2020 (the study was updated in 2012).[12] The authors considered and documented methodologies to determine the values of energy production, generation capacity, T&D deferrals, reduced transformer and line losses, environmental benefits, and natural gas price hedge. The authors found a solar net present value of $1,983–$2,938/kW or, on a levelized basis, $0.109–$0.118/kWh—higher than electricity rates at the time. The additive avoided transmission and distribution (T & D), operation and maintenance (O & M), capacity, and energy cost values ranged from $0.0791 to $0.1411/kWh in 2008 dollars (for reference, current customers under the Standard rate plan pay $0.09417/kWh November–April and $0.0968–-$0.17257/kWh—depending on usage—from May to October). Most of the value comes from avoided energy purchases, followed by O&M, capacity, and T&D savings. In 2011, Richard Perez, Ken Zweibel, and Thomas E. Hoff[13] attempted to describe the combined value that solar energy delivers to utilities’ electric utility customers (energy, capacity) and society’s taxpayers (environmental, fuel price mitigation,[14] outage risk protection, and long-term economic growth), specifically in the New York City area. Perez et al. assess the following costs and values for solar in New York (costs are described as the stream of revenues/incentives needed for a solar developer to break even—$0.20–$0.30/kWh—plus up to $0.05/kWh in infrastructure and operational costs to manage non-controllable solar costs and continue to reliably meet demand.[15] However, the study does not specifically call out net metering or break out the components of the costs to electric utility customers and taxpayers, so it is impossible to understand how net metering credits, billing costs, etc., are being considered in the analysis. In 2012, Richard Perez[16] teamed with Thomas E. Hoff and Benjamin L. Norris in order to study the values that a fleet of distributed solar systems in various configurations delivers to utilities, electric utility customers, and taxpayers in Pennsylvania and New Jersey. The Clean Power Research report estimated levelized values for a fleet of 30-degree-south- tilted distributed solar arrays (which yielded the highest values of all the different configurations) in seven different locations across New Jersey and Pennsylvania: The sum of all values ranges from $256/MWh to $318/MWh in the various locations studied. The authors note that Market Price Reduction and Economic Development Value provide the most benefit; the former (average $55/MWh) attributable to coincidence between locational marginal price and solar output, and the latter (average $44/MWh) reflecting the tax revenue enhancement of local jobs created—even under the conservative assumption that 80 percent of the related manufacturing jobs would remain out of state. As with most studies that attempt to value “jobs created,” the report failed to account for jobs lost because of higher overall energy costs, or the jobs created in the base case of traditional utility operation. The More Things Change, The More They Stay The Same The following discussion illustrates that rate design as it relates to NEM is constantly in a state of flux. That’s because the utility business models, technologies, relative costs, and customer values are constantly in a state of flux. It is the responsibility of rate setting authorities to account for that flux while insuring that costs incurred by providers are reasonable and are allocated in a fair and impartial manner. Duke Energy Corp. asked North Carolina utility regulators to allow it to pay businesses and homeowners less than retail rate for the solar power they generate. The utility wants to overhaul a pricing rule that allows owners of rooftop solar systems to sell the surplus electricity they generate to Duke at 11 cents per kilowatt-hour, the retail bundled rate. Rob Caldwell, Duke’s vice president of renewable generation development, said that the company wants to pay only the generating cost, which is between 5 and 7 cents per kilowatthour regionally. James McLawhorn, director of the electric division of the Public Staff, agreed that the rapid spread of small solar producers is making their fee schedule a concern, because other power customers are subsidizing the higher payments that utilities make for power purchases. (The Public Staff is an independent state agency that advocates for consumers in utility rate cases.)[17] In Arizona, according to Arizona Public Service (APS), the state’s largest utility, each solar customer avoids about $1,000 annually in costs for operating the grid, which residents with net metering use to buy and sell power. As more solar systems are installed, the utility’s costs are spread across fewer users. This will cause power rates to spiral up, primarily harming poor and middle-class residents who spend a larger share of their income on energy. Net metering is already costing the average power user a $16.80 premium per year. In 2013, Arizona Public Service asked the state utility commission to address the cost shift by modifying net metering for future solar adopters. The utility proposed compensating solar customers for their power at the wholesale rather than retail rate, or alternatively, adding a flat charge to their bills to account for the fixed costs they are not sharing. After extensive debate, the commission adopted a plan that would add roughly $5 monthly ($0.70 per kW of installed capacity) to solar customers’ bills. While this surcharge would do little to mitigate the entirety of the cost shift, the commission voted to implement this proposal pending the utility’s next rate review in 2015. The approval can be viewed from two perspectives: First, the principle was approved that solar net metering should pay their share of infrastructure costs. Second, the actual charge needs to be calculated more rigorously. That more rigorous analysis should include all of the factors noted at the beginning of this section, and include less-expensive alternatives, not just a simple comparison of hypothetical benefits and costs. Utilities are beginning to own and operate distributed PV assets. Programs developed across the country over the last year include in Arizona, Georgia and Texas. In New York, Con Edison has proposed a residential solar and storage program as one of its demonstration projects. California received proposals from its IOUs and other stakeholders on future net metering tariffs in late 2015. Proposals included buy-all, sell-all options for customers, new charges and fees, and reduced compensation for net excess generation Utilities across the country also continue to propose substantial increases in residential fixed customer charges. Fixed charge increases remain the most frequent proposed policy change impacting the residential solar NEM market. Several utilities have proposed new rate structures which add demand charges for NEM customers. Demand charges are based on peak energy usage over a billing period. States with pending utility proposals for new residential demand charges as of 2015 include Arizona, California, Kansas, Oklahoma, and Texas. In August 2015, Nevada reached its 235 MW net metering cap. Revised net metering tariffs were to take effect after the cap was reached. Until the Public Utilities Commission approves revised tariffs, new systems are being net metered under existing policies. NV Energy’s proposed successor tariffs feature a new rate class for net metering customers with both time-of-use (TOU) and demand charges. No doubt, the electric power industry is undergoing a period of profound transformation–the fuels and technologies used to generate electricity is getting cleaner and more distributed; the energy grid is becoming more digital; and customers have different expectations. Collaboration, good public policy, and appropriate regulatory policies are critical to a successful transformation of the power sector. In the context of net energy metering, this means reforming policy and rates so that private rooftop solar customers who use the energy grid pay for their use of the grid. The Brookings paper impedes rationale and deliberate reform of net metering policy and should be heavily discounted. [1] http://www.brookings.edu/research/papers/2016/05/23-rooftop-solar-net-metering-muro-saha [2] http://www.brookings.edu/research/opinions/2016/06/13-net-energy-metering-wood [3] Vermont, Nevada, Mississippi, Maine, Minnesota, Massachusetts, and New York. [4] 29 states (and the District of Columbia and Puerto Rico) require utility companies to deliver specified minimum amounts of electricity from “renewable” sources, including wind and solar power. Analysis by Manhattan Institute has revealed a pattern of starkly higher rates in most states with RPS mandates compared with those without mandates. https://www.manhattaninstitute.org/html/highcostrenewableelectricitymandates5987.html [5] http://reason.org/news/show/social-cost-of-carbon-study [6]https://www.misoenergy.org/Library/Repository/Meeting%20Material/Stakeholder/PAC/2014/20140917/20140917%20PAC%20Item%2002%20GHG%20Regulation%20Impact%20Analysis%20-%20Study%20Results.pdf [7] Energy and Environmental Economics, Inc. (2010). Net Energy Metering (NEM) Cost Effectiveness Evaluation (E3 study). Available at http://www.cpuc.ca.gov/PUC/energy/DistGen/nem_eval.htm. [8] Barbose, Galen, Naïm Darghouth, and Ryan Wiser (2010). The Impact of Rate Design and Net Metering on the Bill Savings from Distributed PV for Residential Customers in California. Berkeley, CA: Ernest Orlando Lawrence Berkeley National Laboratory. [9] A feed-in tariff (FIT) is a policy mechanism designed to accelerate investment in renewable energy technologies, by offering long-term above-market fixed prices to renewable energy producers. [10] Beach, Thomas R. and Patrick G. McGuire (2012). Re-evaluating the Cost-Effectiveness of Net Energy Metering in California. Berkeley, CA: Crossborder Energy. [11] Braun, Jerry, Thomas E. Hoff, Michael Kuhn, Benjamin Norris, and Richard Perez (2006). The Value of Distributed Photovoltaics to Austin Energy and the City of Austin. Napa, CA: Clean Power Research, LLC. [12] Harvey, Tim, Thomas E. Hoff, Leslie Libby, Benjamin L. Norris, and Karl R. Rabago (2012): Designing Austin Energy’s Solar Tariff Using a Distributed PV Value Calculator. Austin, TX and Napa, CA: Austin Energy and Clean Power Research. [13] Hoff, Thomas E., Richard Perez, and Ken Zweibel (2011). Solar Power Generation in the US: Too Expensive, or a Bargain? Albany, NY: Clean Power Research, LLC. [14] It is important to note that fuel price hedging almost always only considers the value of avoided price increases, but ignore the lost opportunity of future price reductions, as have been experienced in the past few years in the natural gas market. [15] Hoff, Thomas E., Marc Perez, and Richard Perez (2010). Quantifying the Cost of High PV Penetration. Proc. Of ASES National Conference, Phoenix, AZ. [16] Hoff, Thomas E., Benjamin L. Norris, and Richard Perez (2012). The Value of Distributed Solar Electric Generation to New Jersey and Pennsylvania. Albany, NY: Clean Power Research, LLC. [17] http://www.charlotteobserver.com/2014/01/22/4632118/duke-energy-to-seek-reduction.html#.UuVSZdLTkrg
[1]


